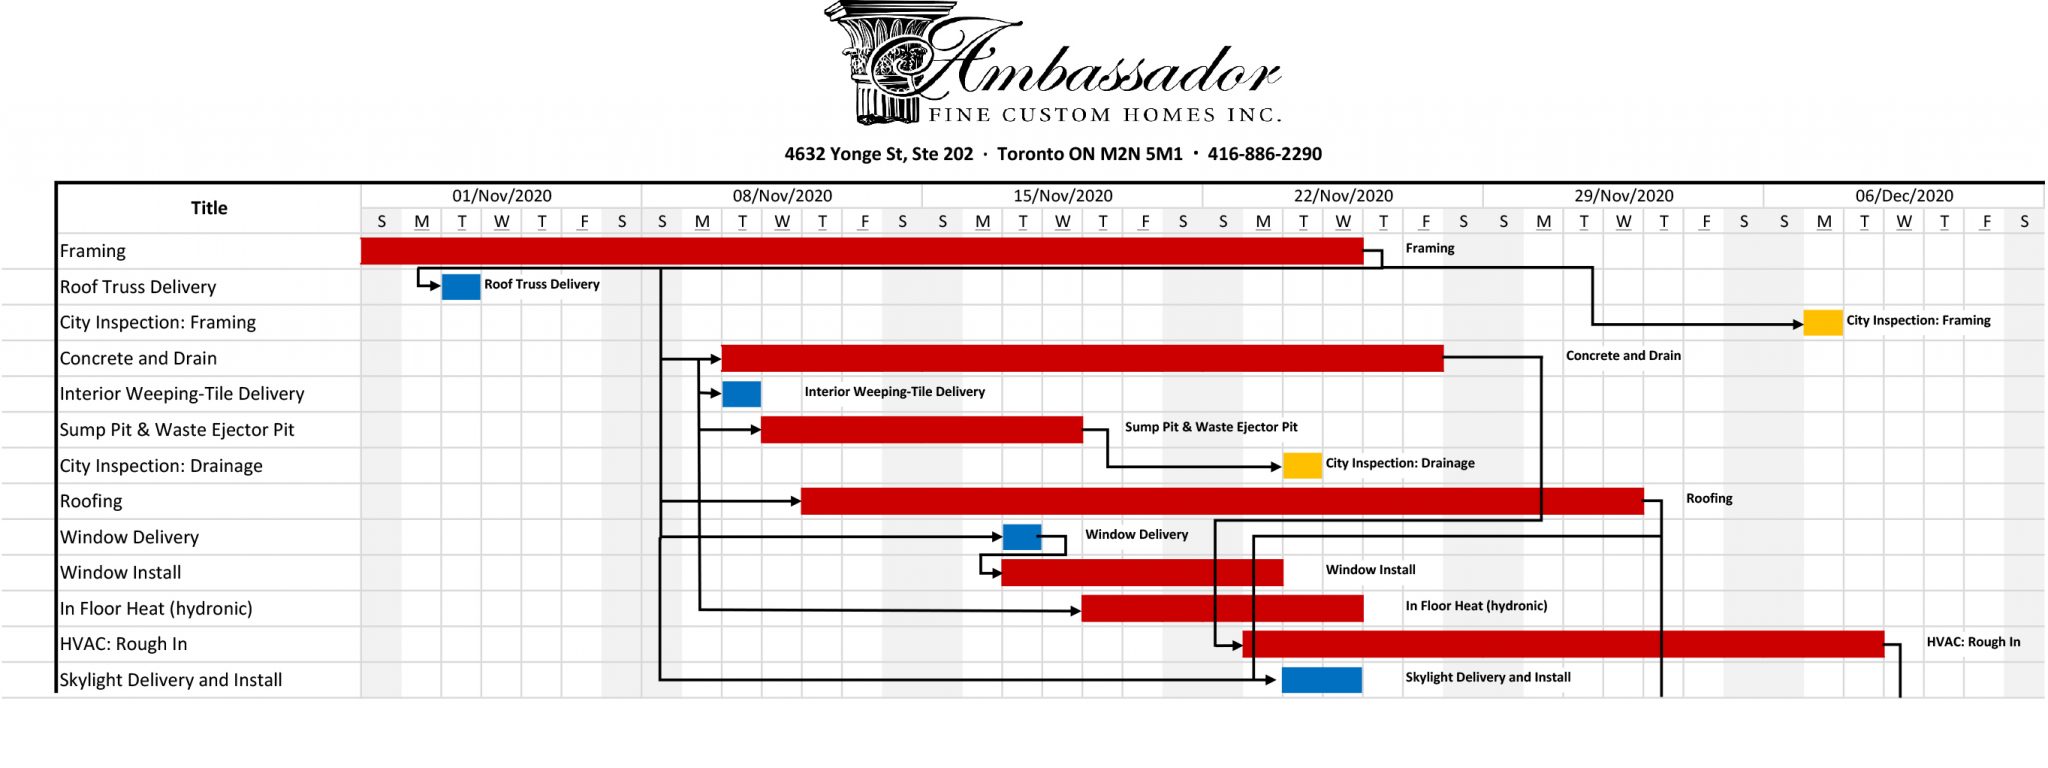
The Gantt Chart is updated bi-weekly giving you a clear picture as to the progress of the project relative to its projected time line, whether it is leading or lagging overall and actual times to complete individual stages of the build
The Gantt Chart is updated bi-weekly giving you a clear picture as to the progress of the project relative to its projected time line, whether it is leading or lagging overall and actual times to complete individual stages of the build